Understand your
business.AURORA BI
The analytics layer your ERP was always missing — Business Central, Oracle, SAP and LS Retail. AI-generated dashboards, plain-English data queries, and real-time insight without a data engineer.
Your ERP runs operations. But it can't answer your questions.
Every business living inside an ERP knows this story. Decisions made in the dark. Reports that arrive too late to matter.
No built-in analytics
Most ERPs ship without a native dashboard or BI layer. You are flying blind on your own data.
SQL & data engineers required
Every report needs a developer. Every question waits days for an answer. Insight becomes a ticketing problem.
Static & stale reports
Your reports show last month. You're making today's million-dollar decisions on yesterday's spreadsheet.
Projects take months
Traditional BI implementations cost a fortune and take quarters to deliver. By then, the question has changed.
One platform. Every insight. Zero complexity.
Aurora BI connects to your ERP, reads your schema with AI, builds a ClickHouse warehouse, generates ETL pipelines, ships dashboards, and lets your team query in plain English — all without code.
Connect
BC · Oracle · SAP · LS Retail
Discover
AI reads your schema
Design
Star-schema warehouse
Sync
Real-time ETL pipelines
Insight
Dashboards & NLP queries
automatically
auto-generated
of the box
23 categories
Everything your business needs
to to understand its data.
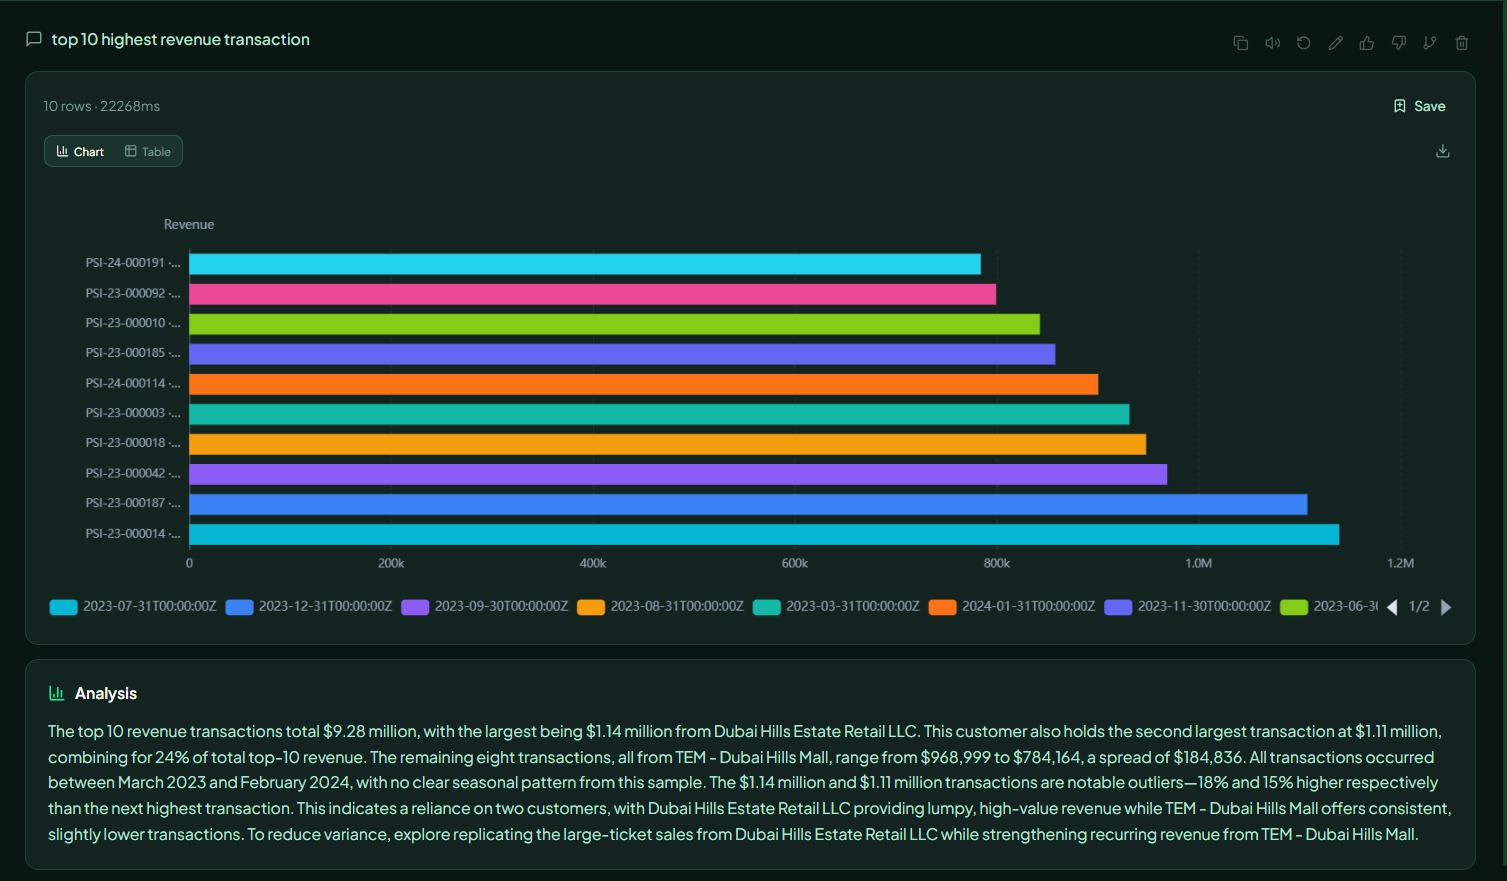
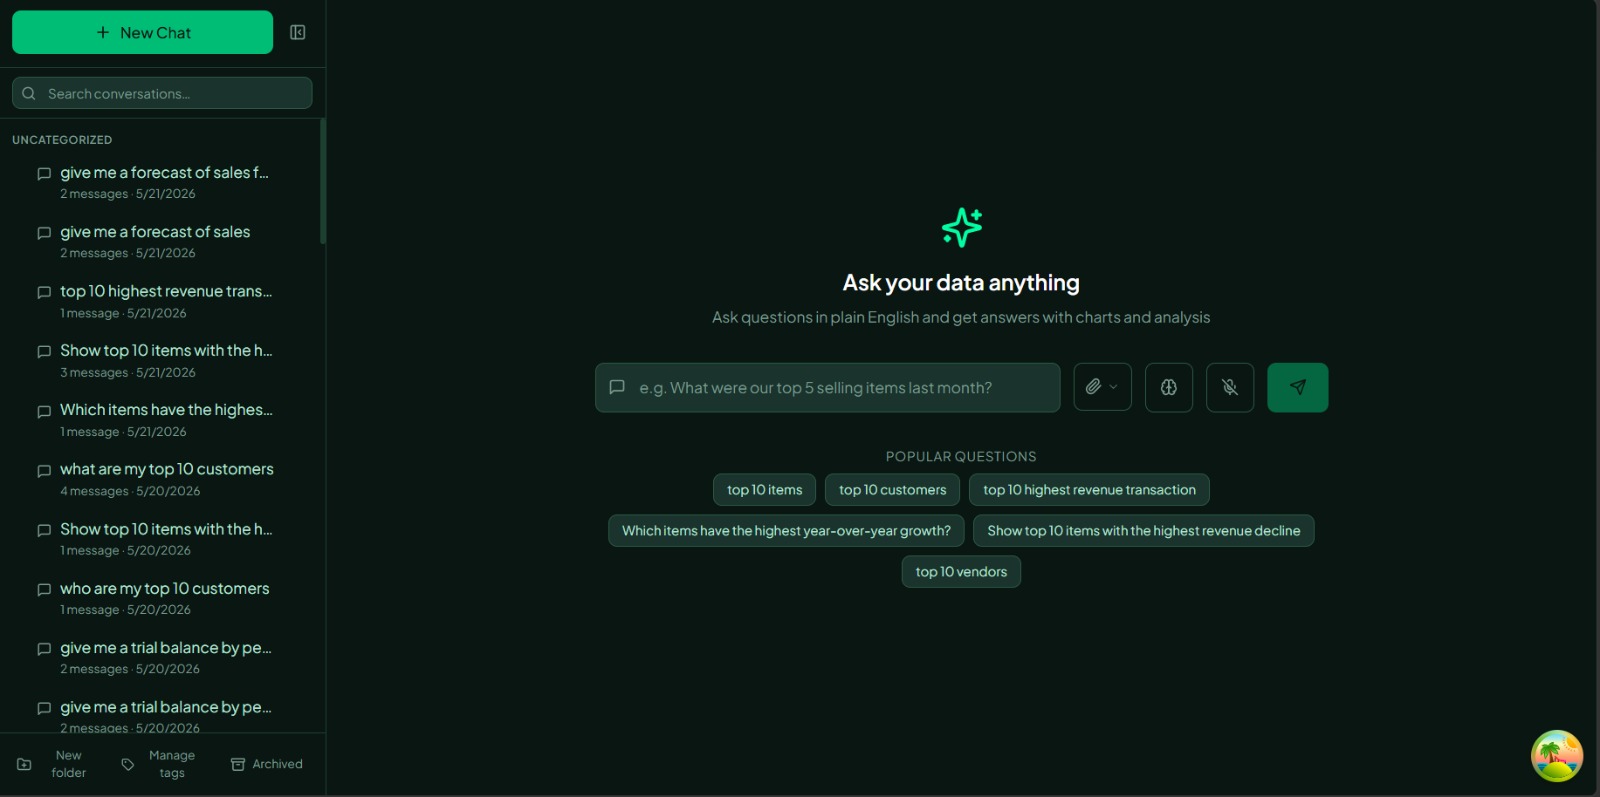
Ask Data — in plain English
Ask plain-English questions about your ERP data. Get instant charts and answers. No SQL required.
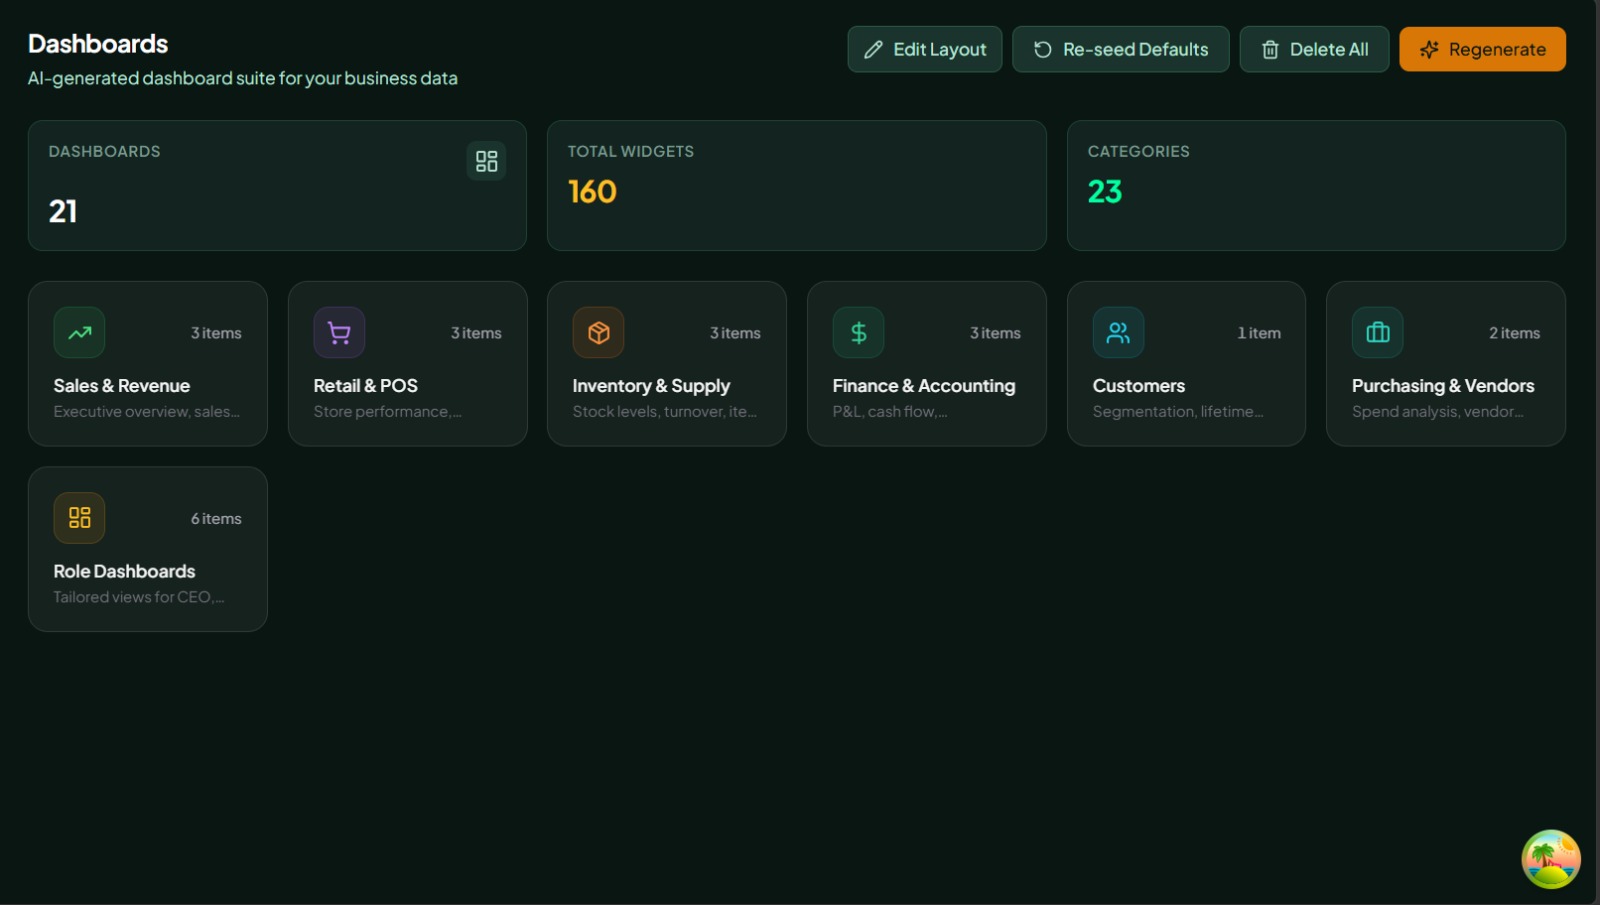
AI Dashboard Generation
Aurora reads your schema and auto-generates Sales, Finance, Inventory and Branch dashboards in hours.
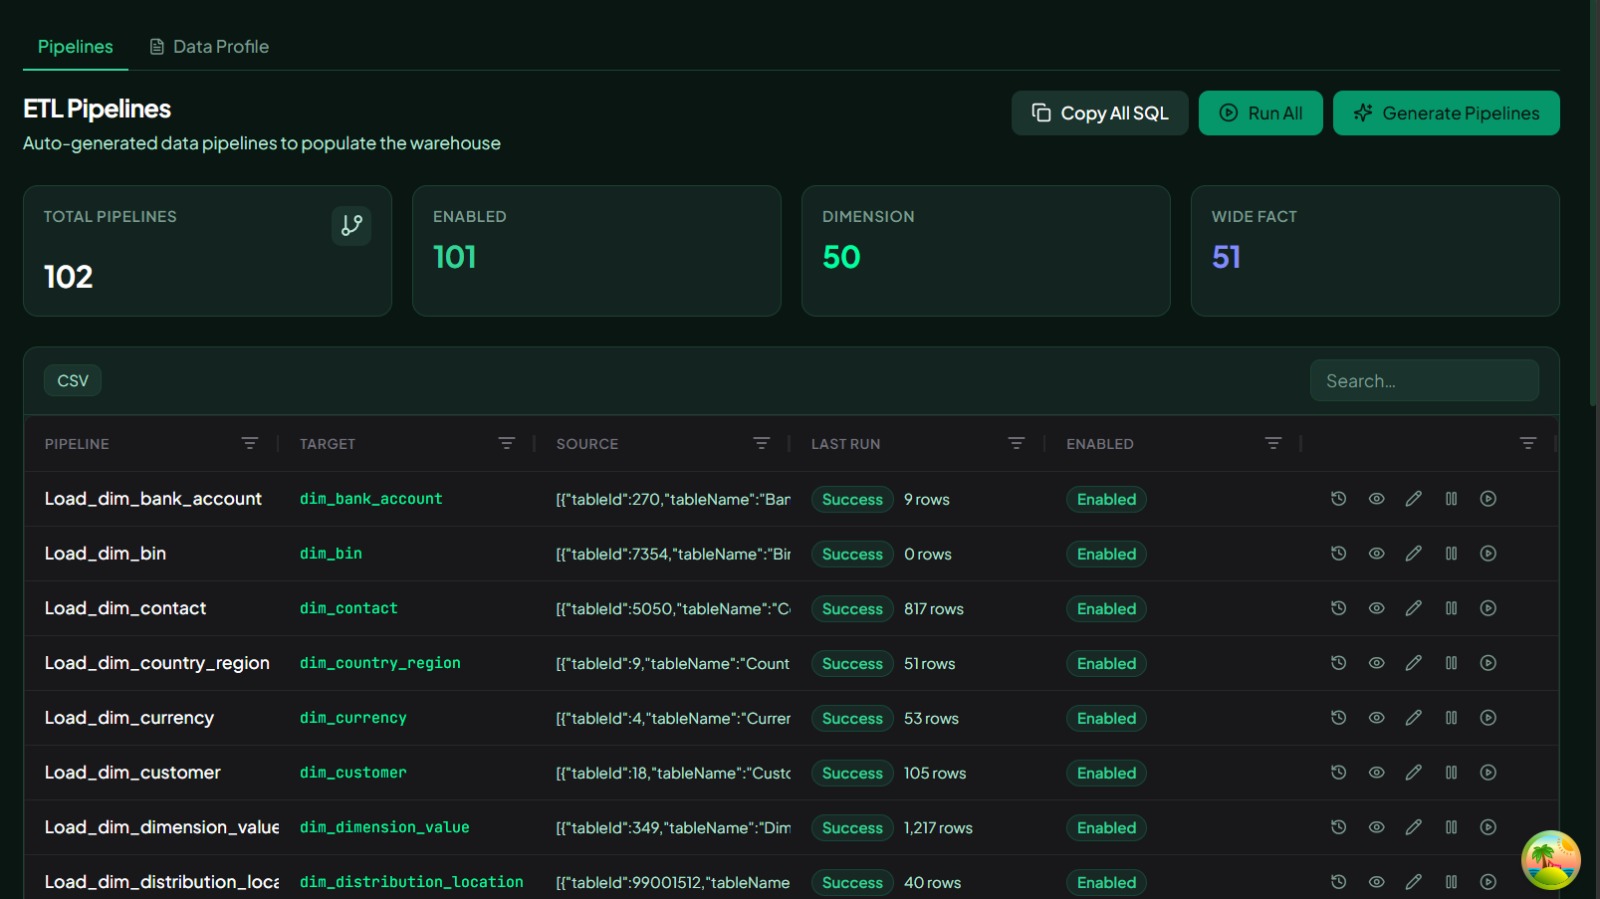
Real-Time ETL Pipelines
Automated data pipelines keep your warehouse fresh and accurate, 24 hours a day, 7 days a week.
Schema Discovery
AI maps your entire ERP database — BC, Oracle, SAP, LS Retail — including custom extensions and localizations.
Multi-Company Support
Manage multiple companies, entities and branches across one or many ERPs from a single analytics platform.
Voice Input & Export
Ask questions by voice. Export the answers as PDF, Excel or CSV with one click — straight from the chart.
Every KPI. Every branch. Every second.
Live KPI tiles, interactive charts and AI-curated narratives in one canvas. Designed for executives, analysts and branch managers alike.
Executive Overview
Monthly Revenue by Branch
Sales Trend
From blind spots to business clarity.
A retailer with 8 branches, two days behind. Here's what changed after Aurora BI shipped to production.
8 branches, 8 spreadsheets, 2 days late.
Every Monday morning the ops manager spent 3 hours collecting Excel files from each branch. Reports were 2 days old. Decisions were guesswork. Finance had no idea which branch was profitable.
All 8 branches, one live dashboard, 4 hours to ship.
Aurora BI connected to Business Central, mapped the schema and shipped a live multi-branch dashboard in an afternoon. Updates every hour. Questions answered in plain English.
From raw data to live insight.
Eight automated steps turn your ERP into an intelligent analytics engine — no engineers, no waiting, no SQL.
Connect your ERP
Cloud Direct API, on-premise agent, or data-lake mirror. Aurora auto-detects your system and opens a secure pipeline in minutes.
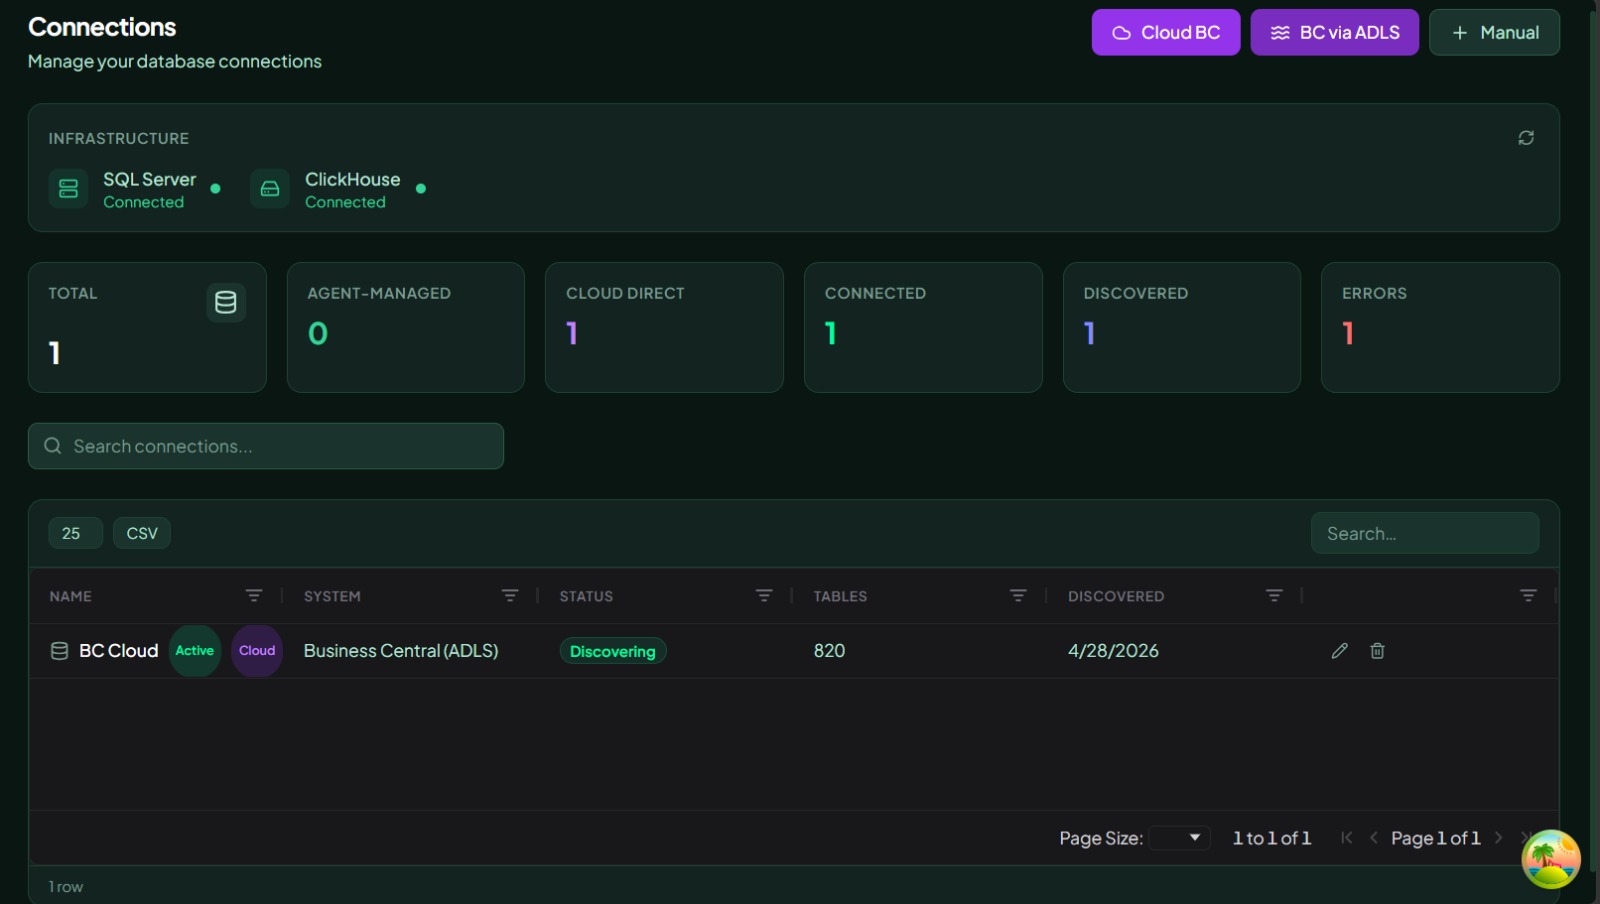 Connected
AI maps your schema
The AI engine walks the entire database — tables, relationships, custom extensions, localizations. No manual mapping. No SQL.
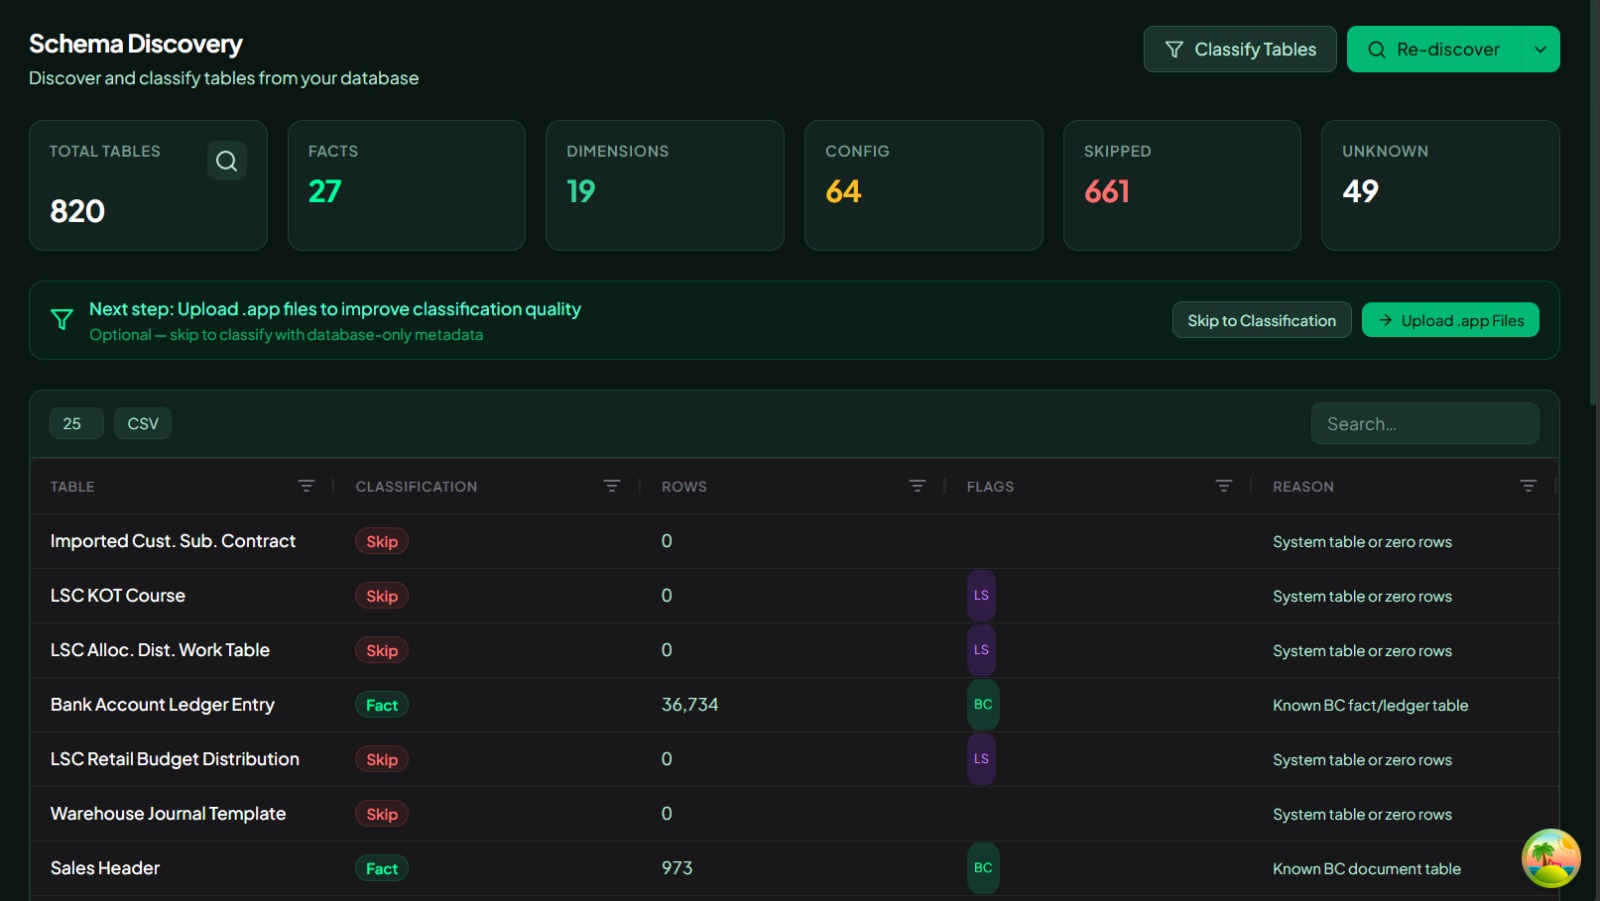 Discovering
Warehouse auto-designed
A ClickHouse star-schema warehouse is designed and deployed automatically. AI refines the schema, you approve and deploy.
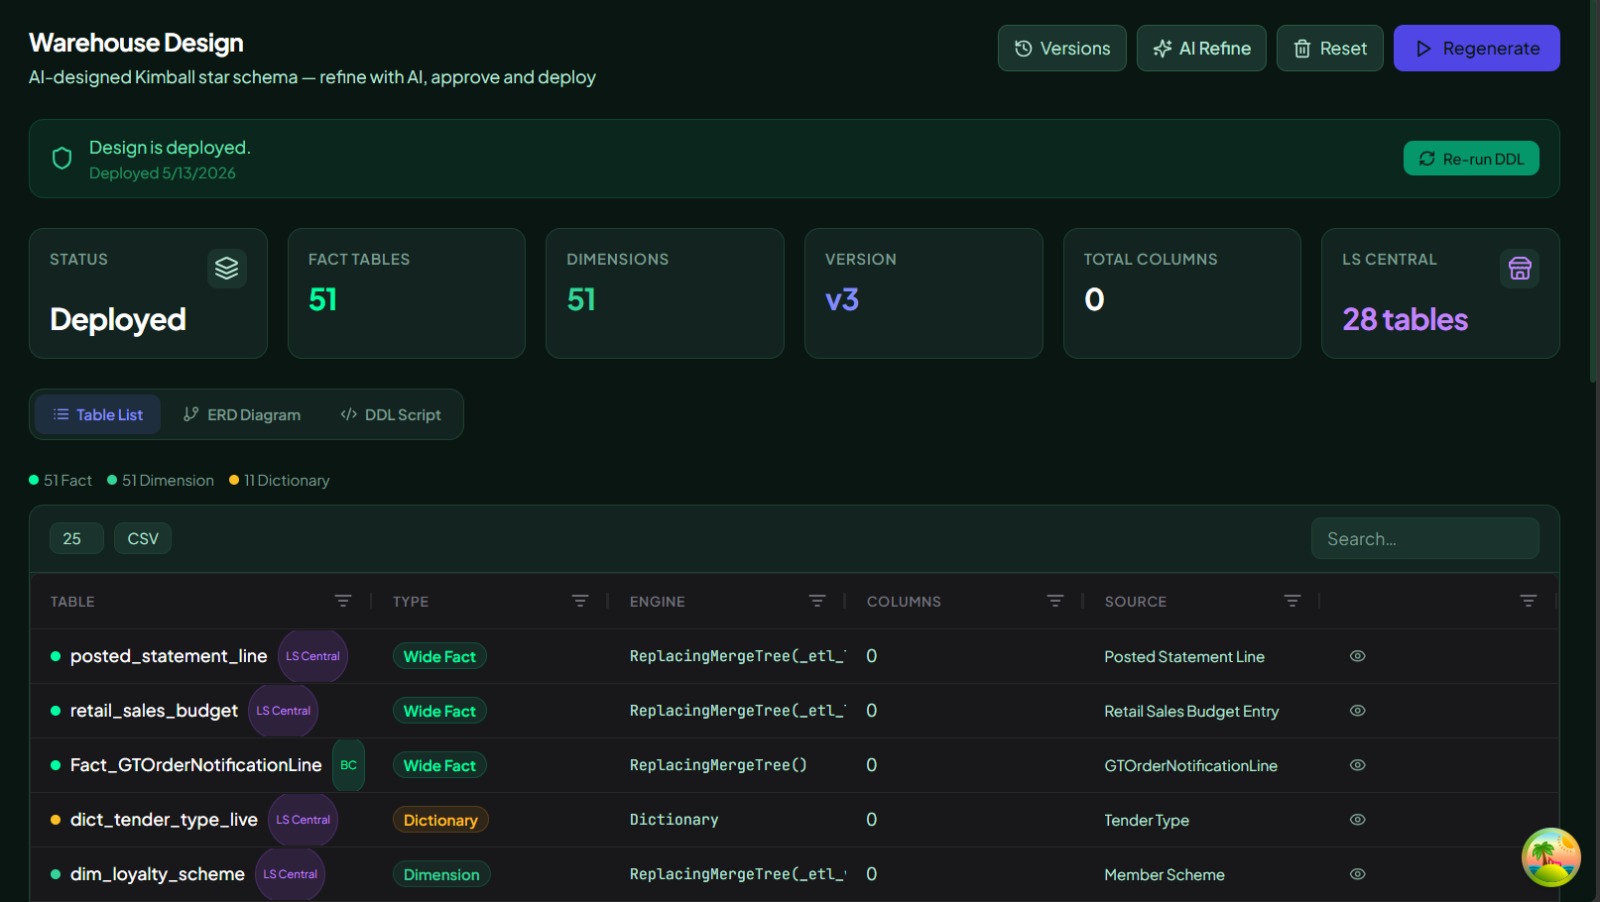 Deployed
Real-time ETL pipelines
102 auto-generated pipelines keep your warehouse fresh. Every dimension, every fact table, synchronized continuously.
 Running
AI-generated dashboards
21 pre-built dashboards across Sales, Retail, Inventory, Finance, Customers and Purchasing. 160 widgets. Zero configuration.
 Live
LiveAsk data in plain English
"Which branch had the lowest margin last week?" Get instant charts, analysis and actionable insight — no SQL, no waiting.
 AI · Ready
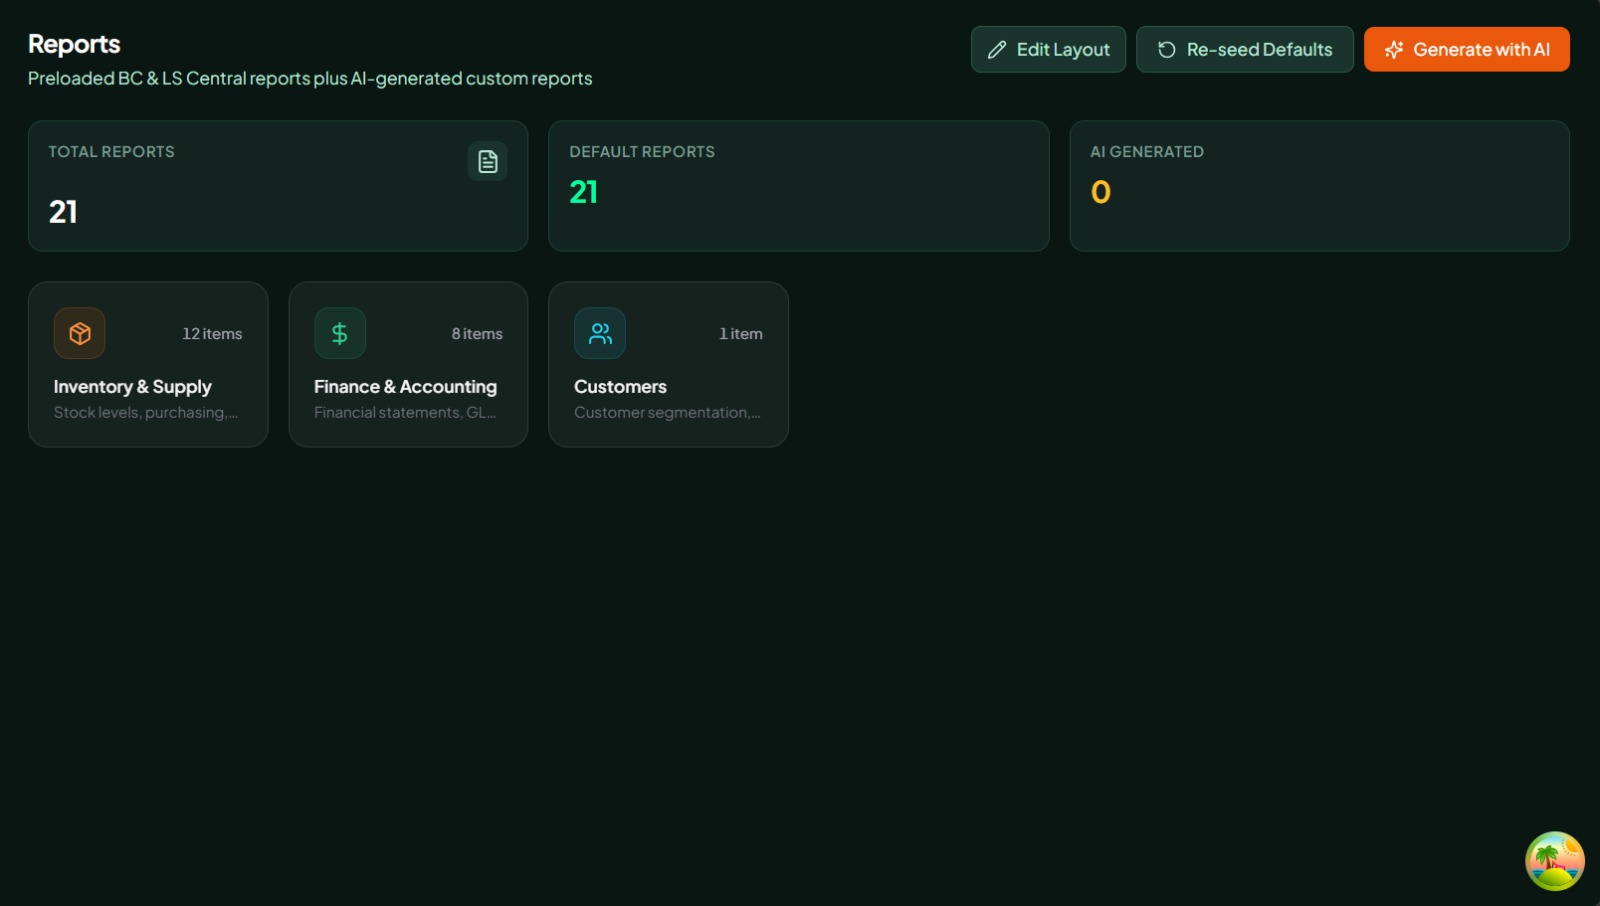
Intelligent reports
Preloaded BC & LS Central reports plus AI-generated custom reports. Export as PDF, Excel or CSV with a single click.
 Ready
ReadyAI-powered analysis
Every query comes with intelligent analysis — trend detection, outlier identification and prescriptive recommendations.
 Insight
Connects to the systems
you already use.
A unified analytics layer for every ERP, data lake and API in your stack.
The numbers that matter to your business.
Save time
Finance teams eliminate Excel exports. Operations get real-time branch data. Execs see the full picture without waiting.
Better decisions
No more making million-dollar decisions on last month's numbers. See what's happening right now across every branch and product line.
Deploy in hours
Traditional BI takes 3–6 months and a team of engineers. Aurora goes from ERP connection to live dashboard in a single afternoon.
Built for Business Central. Unlike anything else.
See Aurora BI live.
We'll connect Aurora BI to your ERP — Business Central, Oracle, SAP or LS Retail — and generate live dashboards in under an hour.